
Category: Work Automation
Python Office Automation#14Auto-Generate PowerPoint Reports! Just Change the Excel Numbers and Your Slides Are Done (python-pptx) 📊
 Author: Mojangcam
This post was translated from the Korean original.
Contents13 sections
Hi there! It's Mojangcam 😎
Last time, we covered how to automatically upload Excel data to Google Sheets (gspread). Collecting, saving, and sharing data is now all handled by Python.
But office work doesn't stop there. Sooner or later, someone has to move those numbers into a PowerPoint deck. Same template every month, only the numbers change. I used to lose two hours at the end of every month pasting tables and redrawing charts.
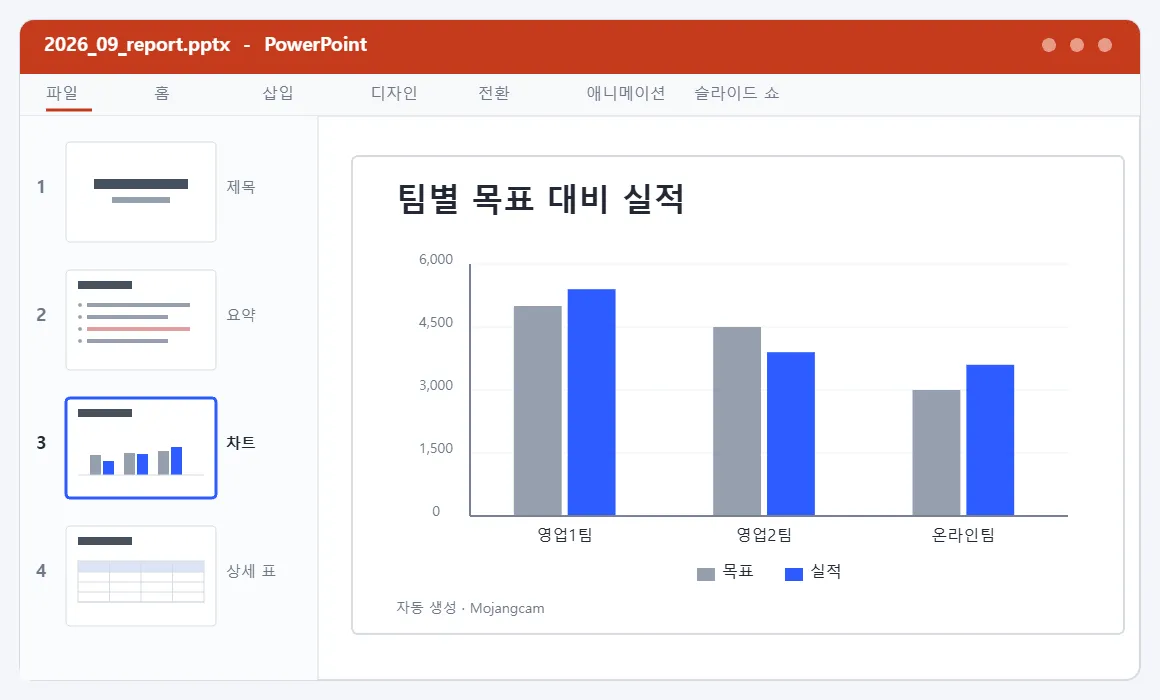
Today, we'll let Python build that deck for you. Change one Excel file, and a 4-slide report pops out automatically: title slide → summary → chart → detailed table. All you need is one library: python-pptx!
📌 What You'll Need
- Python 3.8 or later (python-pptx 1.0.2 has a Requires-Python of
>=3.8) - python-pptx 1.0.2 — a library for creating and editing PPTX files
- openpyxl 3.1.x — used to read the source data from Excel
- You don't even need PowerPoint installed! python-pptx works with the file format directly, so it can create a .pptx without Office. (The file also opens in Hancom Office, Google Slides, and LibreOffice.)
pip install python-pptx openpyxlHere's how to check the install.
python -c "import pptx; print(pptx.__version__)"
# 1.0.2
💡 The package is called python-pptx, but you import it as pptx. If you type pip install pptx, you'll get a completely different package, so be careful!
📌 Step 1 - Prepare the Source Excel File and Read It
First, let's make the Excel file that will feed the report. All you need is this on the first sheet of sales.xlsx.
| Team | Target | Actual |
|---|---|---|
| Sales Team 1 | 5000 | 5400 |
| Sales Team 2 | 4500 | 3900 |
| Online Team | 3000 | 3600 |
Now let's read it with Python.
import openpyxl

def load_rows(xlsx_path):
    wb = openpyxl.load_workbook(xlsx_path, data_only=True)
    ws = wb.active
    rows = []
    for name, target, actual in ws.iter_rows(min_row=2, values_only=True):
        if name is None:
            continue
        rows.append({"name": str(name), "target": int(target), "actual": int(actual)})
    return rows
Let's break it down 💡
- data_only=True : Even if a cell contains a formula, you get the calculated value. Without this, you'd get the formula string itself, like
=B2*1.1. - ws.iter_rows(min_row=2) : Row 1 is the header, so we start reading from row 2.
- values_only=True : You get plain values as tuples instead of cell objects, so you can unpack them right away.
- if name is None: continue : This filters out the empty rows that tag along at the bottom of the sheet. Skip it and you'll hit an
int(None)error!
📌 Step 2 - Understand Slide Layouts and Make a Title Slide
The most confusing part of python-pptx is the layout numbers. The default template has 11 layouts, but in practice you only really use three.
- slide_layouts[0] : Title slide (title + subtitle)
- slide_layouts[1] : Title + content (bulleted body text)
- slide_layouts[5] : Title only (the easiest one when you're placing charts and tables yourself)
from pptx import Presentation
from pptx.util import Inches

prs = Presentation()
prs.slide_width = Inches(10)      # 4:3 aspect ratio
prs.slide_height = Inches(7.5)

slide = prs.slides.add_slide(prs.slide_layouts[0])
slide.shapes.title.text = "September 2026 Performance Report"
slide.placeholders[1].text = "Auto-generated · Mojangcam"
Let's break it down 💡
- Presentation() : Called with no arguments, it starts from the default template. If your company has a template, pass it in like
Presentation("회사양식.pptx")and you'll get that design as-is. This is a genuinely useful real-world tip! - slide_width / slide_height : The default is 4:3 (10×7.5 inches). If you want 16:9, change it to
Inches(13.333) × Inches(7.5). - shapes.title : Grabs the title slot (placeholder) that's built into the layout.
- placeholders[1] : 0 is the title, 1 is the subtitle (or body). The numbers differ by layout, so if you're unsure, print them with
for ph in slide.placeholders: print(ph.placeholder_format.idx, ph.name).
📌 Step 3 - Build the Summary, Chart, and Table Slides
Summary Slide (Bullet Points)
from pptx.dml.color import RGBColor

def add_summary_slide(prs, rows):
    slide = prs.slides.add_slide(prs.slide_layouts[1])
    slide.shapes.title.text = "Summary"
    body = slide.placeholders[1].text_frame

    total_t = sum(r["target"] for r in rows)
    total_a = sum(r["actual"] for r in rows)
    body.text = f"Total target {total_t:,} / actual {total_a:,} (unit: 10,000 KRW)"

    for r in rows:
        rate = r["actual"] / r["target"] * 100
        p = body.add_paragraph()
        p.text = f'{r["name"]} : achievement {rate:.1f}%'
        p.level = 1
        if rate < 100:
p.runs[0].font.color.rgb = RGBColor(0xC0, 0x00, 0x00)- text_frame.text = ... : This fills the first paragraph. From the second line on, you need
add_paragraph(). - p.level = 1 : The indent level. 0 is the top level, and the bigger the number, the deeper the indent.
- p.runs[0].font.color.rgb : Only teams that missed their target are highlighted in red text. Setting a value with
p.textcreates exactly one run, so you can grab it withruns[0].
Chart Slide (A Real, Editable PowerPoint Chart!)
from pptx.chart.data import CategoryChartData
from pptx.enum.chart import XL_CHART_TYPE, XL_LEGEND_POSITION

def add_chart_slide(prs, rows):
    slide = prs.slides.add_slide(prs.slide_layouts[5])
    slide.shapes.title.text = "Target vs. Actual by Team"

    data = CategoryChartData()
    data.categories = [r["name"] for r in rows]
    data.add_series("Target", [r["target"] for r in rows])
    data.add_series("Actual", [r["actual"] for r in rows])

    graphic_frame = slide.shapes.add_chart(
        XL_CHART_TYPE.COLUMN_CLUSTERED,
        Inches(0.8), Inches(1.8), Inches(8.4), Inches(4.5),
        data,
    )
    chart = graphic_frame.chart
    chart.has_legend = True
    chart.legend.position = XL_LEGEND_POSITION.BOTTOM
    chart.legend.include_in_layout = False
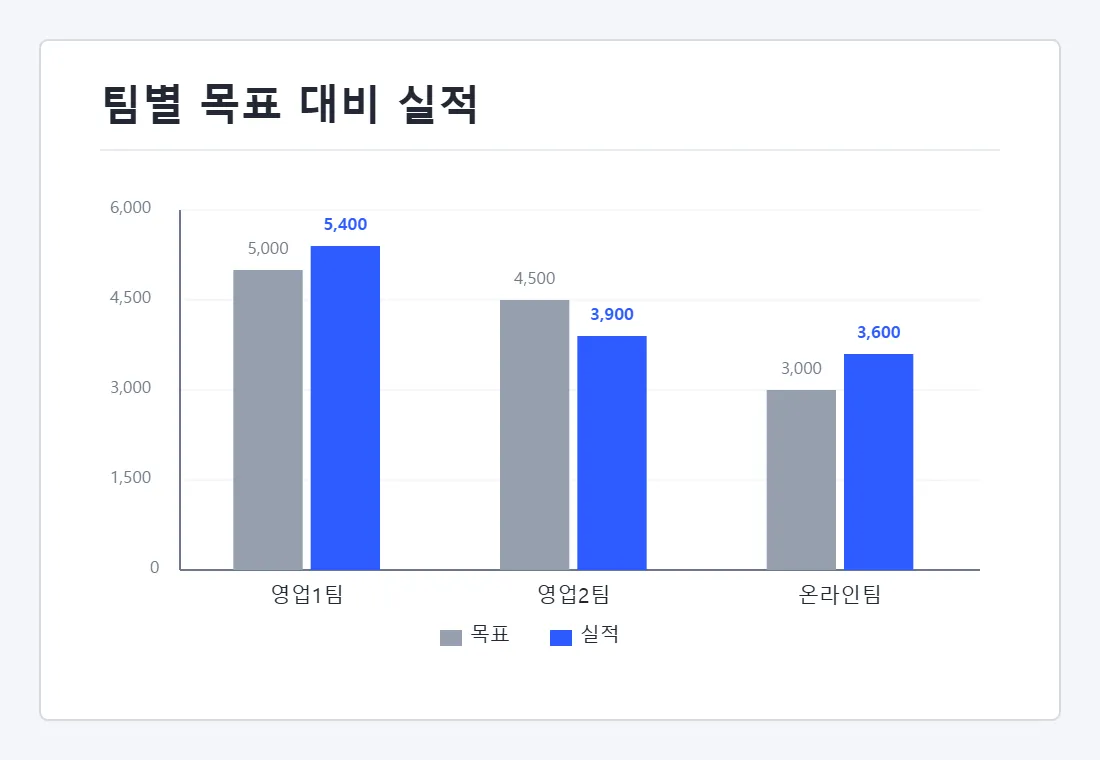
This is the best part of python-pptx. What goes in is a native PowerPoint chart, not an image. When your manager says "can you fix this number?" right before the presentation, you can edit it directly in PowerPoint! 🙌
- XL_CHART_TYPE.COLUMN_CLUSTERED : Clustered columns. For a line chart use
LINE, for a pie chartPIE, and for horizontal barsBAR_CLUSTERED. - add_chart(type, left, top, width, height, data) : Position and size all go in as
Inches()orCm(). The top-left corner of the slide is (0, 0). - legend.include_in_layout = False : Keeps the legend from eating into the plot area and squeezing it. Leave this out and your chart gets oddly squashed.
Table Slide
from pptx.util import Pt

def add_table_slide(prs, rows):
    slide = prs.slides.add_slide(prs.slide_layouts[5])
    slide.shapes.title.text = "Detailed Table"

    table = slide.shapes.add_table(
        len(rows) + 1, 4, Inches(0.8), Inches(1.8), Inches(8.4), Inches(0.8)
    ).table

    for col, head in enumerate(["Team", "Target", "Actual", "Achievement"]):
        table.cell(0, col).text = head

    for i, r in enumerate(rows, start=1):
        rate = r["actual"] / r["target"] * 100
        table.cell(i, 0).text = r["name"]
        table.cell(i, 1).text = f'{r["target"]:,}'
        table.cell(i, 2).text = f'{r["actual"]:,}'
table.cell(i, 3).text = f"{rate:.1f}%"- add_table(rows, cols, left, top, width, height) : You need one extra row for the header, hence
len(rows) + 1. - Don't forget the
.tableat the end!add_table()returns a shape (GraphicFrame), and to work with cells you need the.tableinside it. So many people miss this and end up staring at anAttributeError😅 - height is a minimum height, so PowerPoint grows the table on its own as rows are added.
📌 Full Code (Copy-Paste Ready)
# python-pptx 1.0.2 / openpyxl 3.1.x / Python 3.8+
from pathlib import Path

import openpyxl
from pptx import Presentation
from pptx.chart.data import CategoryChartData
from pptx.dml.color import RGBColor
from pptx.enum.chart import XL_CHART_TYPE, XL_LEGEND_POSITION
from pptx.util import Inches, Pt

XLSX_PATH = Path("sales.xlsx")
OUT_PATH = Path("output/2026_09_report.pptx")
POINT_COLOR = RGBColor(0x2E, 0x5B, 0xFF)

def load_rows(xlsx_path):
    wb = openpyxl.load_workbook(xlsx_path, data_only=True)
    ws = wb.active
    rows = []
    for name, target, actual in ws.iter_rows(min_row=2, values_only=True):
        if name is None:
            continue
        rows.append({"name": str(name), "target": int(target), "actual": int(actual)})
    return rows

def add_title_slide(prs, title, subtitle):
    slide = prs.slides.add_slide(prs.slide_layouts[0])
    slide.shapes.title.text = title
    slide.placeholders[1].text = subtitle
    return slide

def add_summary_slide(prs, rows):
    slide = prs.slides.add_slide(prs.slide_layouts[1])
    slide.shapes.title.text = "Summary"
    body = slide.placeholders[1].text_frame
    total_t = sum(r["target"] for r in rows)
    total_a = sum(r["actual"] for r in rows)
    body.text = f"Total target {total_t:,} / actual {total_a:,} (unit: 10,000 KRW)"
    for r in rows:
        rate = r["actual"] / r["target"] * 100
        p = body.add_paragraph()
        p.text = f'{r["name"]} : achievement {rate:.1f}%'
        p.level = 1
        if rate < 100:
            p.runs[0].font.color.rgb = RGBColor(0xC0, 0x00, 0x00)
    return slide

def add_chart_slide(prs, rows):
    slide = prs.slides.add_slide(prs.slide_layouts[5])
    slide.shapes.title.text = "Target vs. Actual by Team"

    data = CategoryChartData()
    data.categories = [r["name"] for r in rows]
    data.add_series("Target", [r["target"] for r in rows])
    data.add_series("Actual", [r["actual"] for r in rows])

    graphic_frame = slide.shapes.add_chart(
        XL_CHART_TYPE.COLUMN_CLUSTERED,
        Inches(0.8), Inches(1.8), Inches(8.4), Inches(4.5),
        data,
    )
    chart = graphic_frame.chart
    chart.has_legend = True
    chart.legend.position = XL_LEGEND_POSITION.BOTTOM
    chart.legend.include_in_layout = False
    chart.plots[0].series[1].format.fill.solid()
    chart.plots[0].series[1].format.fill.fore_color.rgb = POINT_COLOR
    return slide

def add_table_slide(prs, rows):
    slide = prs.slides.add_slide(prs.slide_layouts[5])
    slide.shapes.title.text = "Detailed Table"

    table = slide.shapes.add_table(
        len(rows) + 1, 4, Inches(0.8), Inches(1.8), Inches(8.4), Inches(0.8)
    ).table
    for col, head in enumerate(["Team", "Target", "Actual", "Achievement"]):
        table.cell(0, col).text = head
    for i, r in enumerate(rows, start=1):
        rate = r["actual"] / r["target"] * 100
        table.cell(i, 0).text = r["name"]
        table.cell(i, 1).text = f'{r["target"]:,}'
        table.cell(i, 2).text = f'{r["actual"]:,}'
        table.cell(i, 3).text = f"{rate:.1f}%"
    for row in table.rows:
        for cell in row.cells:
            for p in cell.text_frame.paragraphs:
                for run in p.runs:
                    run.font.size = Pt(14)
    return slide

def main():
    rows = load_rows(XLSX_PATH)
    prs = Presentation()
    prs.slide_width = Inches(10)      # for 16:9, use Inches(13.333)
    prs.slide_height = Inches(7.5)

    add_title_slide(prs, "September 2026 Performance Report", "Auto-generated · Mojangcam")
    add_summary_slide(prs, rows)
    add_chart_slide(prs, rows)
    add_table_slide(prs, rows)

    OUT_PATH.parent.mkdir(parents=True, exist_ok=True)
    prs.save(OUT_PATH)
    print(f"완료: {OUT_PATH} (슬라이드 {len(prs.slides)}장)")

if __name__ == "__main__":
    main()
📌 Result
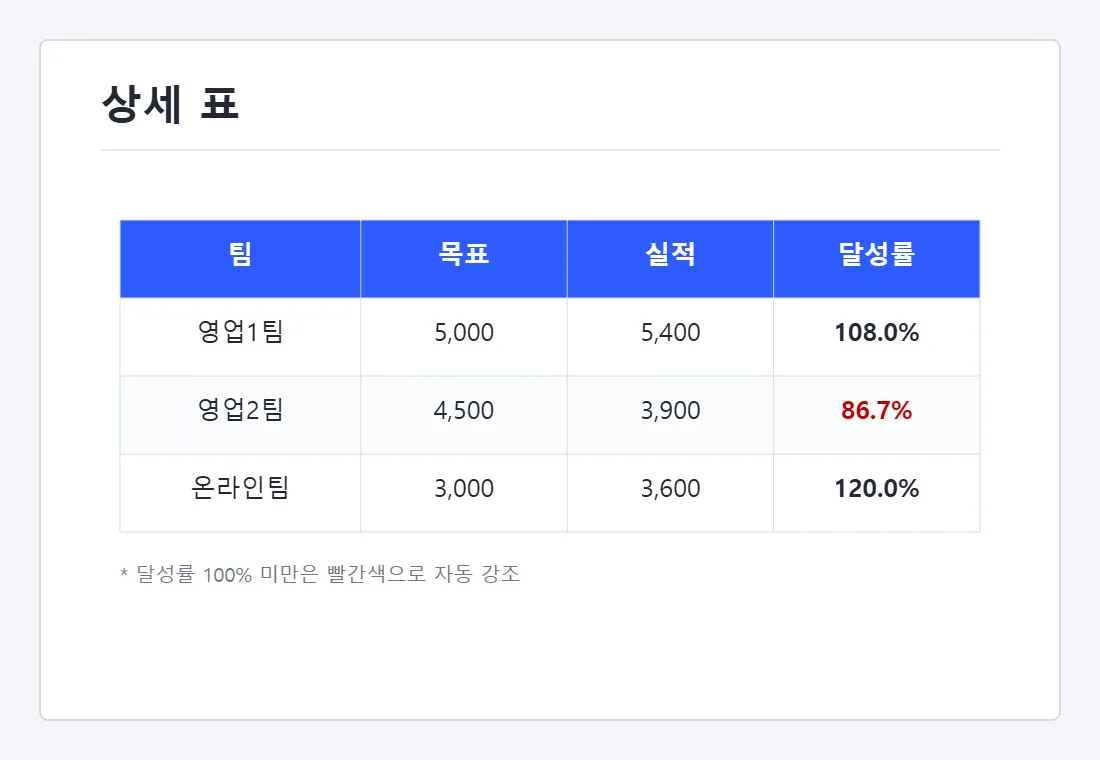
python make_report.py완료: output/2026_09_report.pptx (슬라이드 4장)Open the file that appears in the output folder and you'll find 4 slides in order: title → summary → chart → table. Click the chart and choose "Edit Data," and an Excel window pops up. That's proof it's a real PowerPoint chart 😎
And next month? Just change the numbers in sales.xlsx and run it again. That's it. A two-hour job becomes a two-second one.
📌 Bonus - Use Your Company Template As-Is 💡
If you want the design to match too, just open your company template and build on it.
prs = Presentation("회사양식.pptx")

# First, check which layouts this template has!
for i, layout in enumerate(prs.slide_layouts):
    print(i, layout.name)
Every template orders its layouts differently, so the safe move is to print the numbers and pick the layout index you want. You can keep the existing slides and append new ones after them, or keep a blank template file (a pptx with only the master) around and use that. Both work well.
📌 Common Errors
1. ModuleNotFoundError: No module named 'pptx'
- Cause: You installed the wrong package with
pip install pptx, or it went into a different virtual environment - Fix: Reinstall with
pip install python-pptx. If you're not sure where it's being installed, usepython -m pip install python-pptxso it installs into the same interpreter you'll run with. That settles it.
2. AttributeError: 'GraphicFrame' object has no attribute 'cell'
- Cause: You didn't add
.tableafteradd_table() - Fix: Chain it all the way:
shapes.add_table(...).table.
3. KeyError: 'no placeholder on this slide with idx == 1'
- Cause: That layout has no placeholder number 1. In particular,
slide_layouts[5](title only) has no body slot - Fix: Check the real numbers with
for ph in slide.placeholders: print(ph.placeholder_format.idx, ph.name), or useslide_layouts[1]if you need a body.
4. PermissionError: [Errno 13] Permission denied: '...pptx'
- Cause: You ran the script while the PPT file it's trying to create was open in PowerPoint
- Fix: Close the file and run it again. In real work, it's better to put the date in the file name, like
2026_09_report_20260920.pptx, so you never overwrite anything.
5. Korean text shows up as boxes (□□□)
- Cause: It's not a code problem. The presentation PC just doesn't have that font
- Fix: Set a default font that every PC has, like
run.font.name = "맑은 고딕"(Malgun Gothic). Unusual fonts don't travel with the file.
📌 Wrapping Up
Today we used python-pptx to automatically generate a 4-slide PPT report from Excel data. To sum it up 💬
- Start with
Presentation(), and knowing just three layouts,slide_layouts[0/1/5], covers most cases - Charts:
CategoryChartData+add_chart()→ a real PPT chart, not an image - Tables:
add_table(...).table, and don't forget the.tableat the end - Reuse your company template as-is with
Presentation("양식.pptx")
Hook this up to the earlier episodes and you've got the full package. Collect data with crawling and Sheets → build the PPT with what you learned today → send it to your manager with automated emails. A pipeline no human hand ever has to touch!
In the next episode, we'll cover converting the finished report to PDF and distributing it, and after that we'll wrap up the series with 🏆 the final project - a work report system that lands in your inbox every morning on its own, combining everything we've learned so far. Stay tuned 🙌
If you have questions, leave a comment 💬 See you in the next episode!
📚 Python Office Automation Series
- #10 - Auto-Generate Word Documents (python-docx) → Read it
- #11 - Send Personalized Bulk Emails Automatically (smtplib) → Read it
- #12 - Connect to Google Sheets (gspread) → Read it
- #13 - Build a Logging, Retry, and Failure Alert System (logging·tenacity)
- #14 - Auto-Generate PowerPoint Reports (python-pptx) ← You are here!
- #15 - PDF Conversion & Distribution (coming soon)
Series · Part 14 of 14
Python Office Automation
- #1엑셀 자동화 입문 (openpyxl)! (Korean)
- #2웹 크롤링 입문 (requests + BeautifulSoup)! (Korean)
- #3파일 정리 자동화 (이름 일괄 변경)! (Korean)
- #4디스코드 웹훅(Webhook)으로 알림 보내기 (requests)! (Korean)
- #5로컬 LLM(LM Studio)으로 고객 문의 자동 분류·요약하기! (무료 AI) (Korean)
- #6예약 실행 자동화! 매일 정해진 시간에 스크립트 돌리기 (schedule·APScheduler) (Korean)
- #7동적 페이지·로그인 자동화! requests로 안 되는 사이트 긁기 (Selenium) (Korean)
- #8PDF 자동 처리! 여러 파일 병합·분할부터 비밀번호까지 (pypdf) 📄 (Korean)
- #9마우스·키보드 GUI 자동화! 클릭·타이핑을 파이썬이 대신하게 하기 (PyAutoGUI) (Korean)
- #10워드(Word) 문서 자동 생성! 엑셀 명단으로 계약서·안내문 100장 뽑기 (python-docx) 📄 (Korean)
- #11개인화 대량 메일 자동 발송! 명단별 첨부파일·발송 로그·재시도까지 (smtplib 실전편) 📬 (Korean)
- #12구글 시트 연동하기! 팀원과 같이 보는 자동 시트 (gspread) 📗 (Korean)
- #13파이썬 자동화 로그·재시도·디스코드 실패 알림 만들기 - 조용히 멈추는 스크립트 잡기 (Korean)
- #14Auto-Generate PowerPoint Reports! Just Change the Excel Numbers and Your Slides Are Done (python-pptx) 📊You are here
Show all 14Collapse
